I added an additional chart below, to show how a market can be shown visually. This makes it pretty easy to determine where we want to concentrate our investments in the future. By checking out the site on a regular basis, we can make trades and develop an aggressive portfolio and make our investments grow.
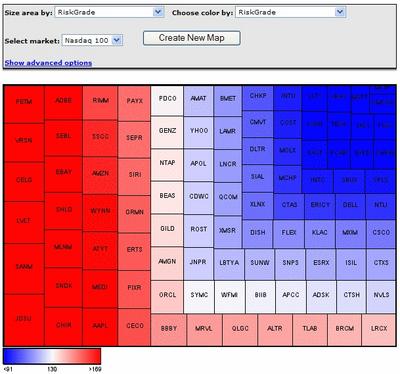
The map above shows the
Nasdaq 100 last week. You can get a current snapshot by going to the riskgrades.com site.


No comments:
Post a Comment